|
For listening and detecting meteors you need at least 2 software or even 3 if your receiver is controlled via PC like me.
Luckily they are free!
Summary :
IC-PCR 1000 ou 1500 receiver configuration :
I have an IC-PCR 1500, not found today or used...
I put here a screenshot of my configuration.
This will be useful to you and may save you time on the search for the right config, including on another receiver, if you are observing the GRAVES or BRAMS radar.
I am in SSB USB mode (Up Side Band) 6Khz bandwidth.
If it does not work for you (no echoes outside Europe on this frequency) you will have to look for another frequency with other settings...

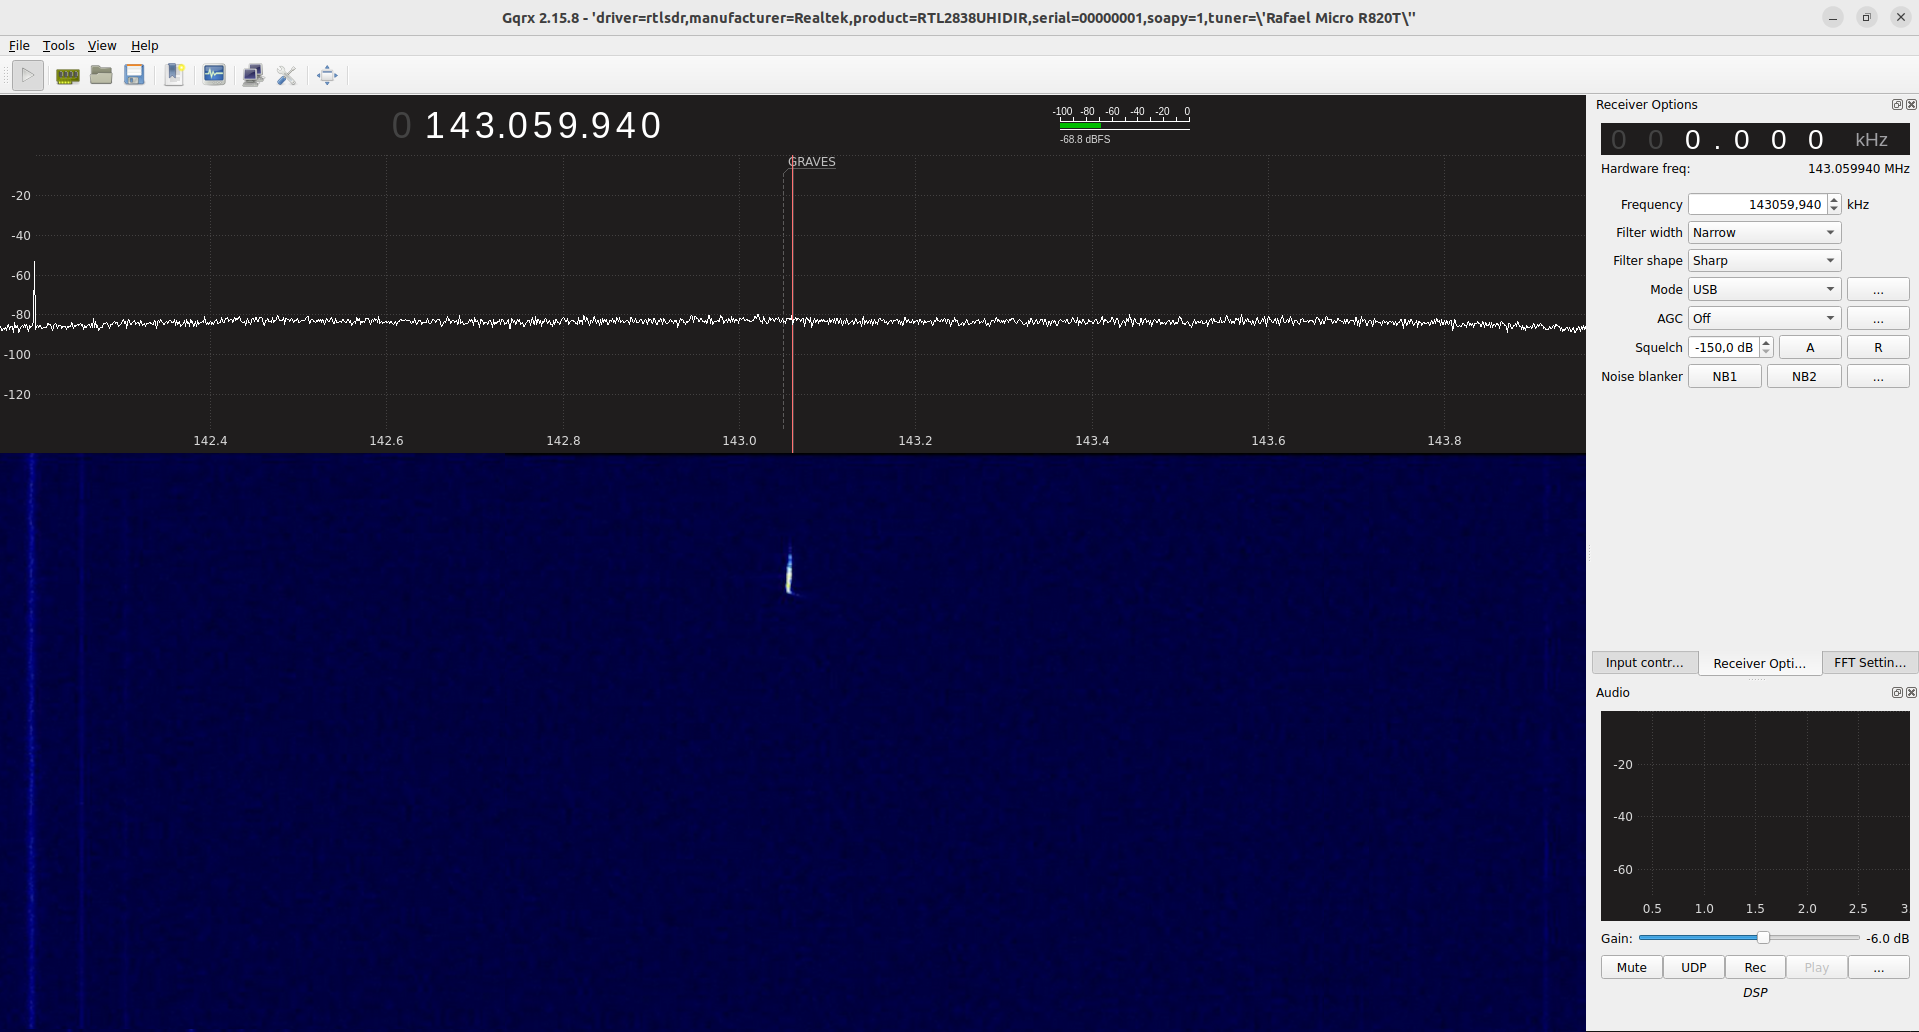
If you are using an RTL-SDR dongle or a more advanced SDR receiver here is a screenshot of the classic Airspy

Below is the screen of the free software GQRX for Linux, it works on Raspberry Pi for example and it is very easy to use
Its installation under Windows is quite difficult, but possible see this video: https://www.youtube.com/watch?v=fZRuAlPtitk
Audio spectrum analysis :
It should also filter the low frequency signal (sound frequencies) which leaves the receiver to keep only the signal we are interested. The width depends on the analyzed frequency frequency range and above the observed interference level in the band. On TV I band I used only 40 to 50hz, for radar Graves, I have a lot less interference suddenly I 300Hz filter between 800 and 1100Hz.
this is the "visual" aspect of your software spectro you know what to take.
I use HROFFT from Kazuhiko Ohkawa download here -> HROFFTf100.zip
if you download Colorgramme it is included in the install
You can also use SpectrumLab or MAnalyzer varies only how to configure to find visit www.rmob.org links area
using HROFFT :
1°) unzip hrofft100f.zip in a folder of your choice.
2°) Edit Header.txt file in root of this directory, edit parameters and save.
her is the sample content of my file :
SM
Observer : your name
Receiving Location : city
Receiver :
receiver - frequency used
Receiving antenna : your antenna
| SM |
Prefix of the filename. HROFFT make images in PNG format which correspond to a 10mn scan with name :
SMyymmjjhhmm ie SM+year on 2 digit + month on 2 digit + day on 2 digit + hour on 2 digit + minutes on 2 digit. Example :
SM0804211100.png = le 21 avril 2008 à 10h00 UT
You can replace SM by your initials for example. |
| Observer |
Observer name |
| Receiving Location |
Observer location |
| Receiver |
used receiver |
| Receiving antenna |
used antenna |
Run HROFFT (screen shot below), and adjust the value (1), the signal strength on the sound card from the receiver to have a "black" and blue bars down fairly prominent background, unless echo biensur. In my case this value is high "80" because the strength of the input signal is low "6", but you can have a strong input "50" for example, and a small "10" level signal sugnal. The radar echo occurs if the blue signal (bottom) exceeds the first horizontal gray bar (10dB level). We see that all the echoes are not counted, it is a compromise because there are also parasites (blue strip right), it is better to lose small echoes that count anything!. Also adjust the frequency filter (2) as it acts on the signal level, since it is the sum of the signals in the bandwidth. In my case echoes are centered on 780Hz and I chose to filter 740-850 100 Hz to 150Hz bandwidth is good. See for yourself after you make the findings. We see the frequency spread on how echoes of the type in (4). Discrete in the vertical (3) gray bar indicates the bandwidth in the image. Once these settings are made, and leave to rest to HROFFT Colorgramme Lab

Colorgramme Lab :
I created with my friend Philippe Colorgramme Beef to meet several needs.
Some audio spectrum software count meteors, some not, but none shows the result of an understandable way.
So I gathered a universal software "reader" of the file output format from spectro audio software used by the observers and a system of simple visualization, inspired by Ghent University.
Colorgramme outputs a text of a STANDARD file format used by the Radio Meteor Observing Bulletin (RMOB), the reference in this field. Radio Meteor Observing Bulletin (RMOB)
Finally I created a website that allows live viewing of observer data using Colorgramme because it transfer data via FTP on www.rmob.org
In short it is a sort of Swiss Army knife of the observer of meteors by radio.
Let's use starting with the download here
Run install and follow the instructions, it's easy !
At run Colorgramme Lab asks you to fill in the "Observer" form so that your data is indentified on the web and for RMOB. Here's mine for example. You can "geotag" by clicking on the link [Open Street Map observer coordinates HELP]
cut and paste your Longitude and Latitude in Colorgramme this will be useful later for you to locate and especially for making astronomical calculations on your data requires knowledge your position. Save and restart Colorgramme it does not hurt ;-)

We imagine HROFFT is already running for more than 10 minutes so that one or PNG images exist in the folder where you have installed. If less than 10 minutes, wait for the creation of the first image before proceeding to this step in Colorgramme. If it's been hours or days there are no problems Colorgramme knows how to accommodate.
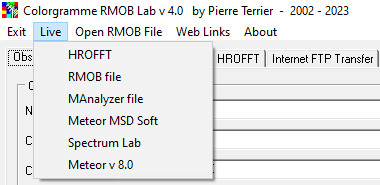 Click on the "Live" menu and the submenu "Hrofft" then in the window that opens click on image files that correspond to the image of the MONTH. Click on the "Live" menu and the submenu "Hrofft" then in the window that opens click on image files that correspond to the image of the MONTH.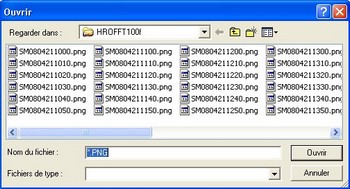
If there are many files pretreatment images by Colorgramme will take time so be patient until the cursor is no longer an "progressbar" named "data processing" flashes.
After this step Colorgramme automatically opens the "colorgramme" tab to view your data.
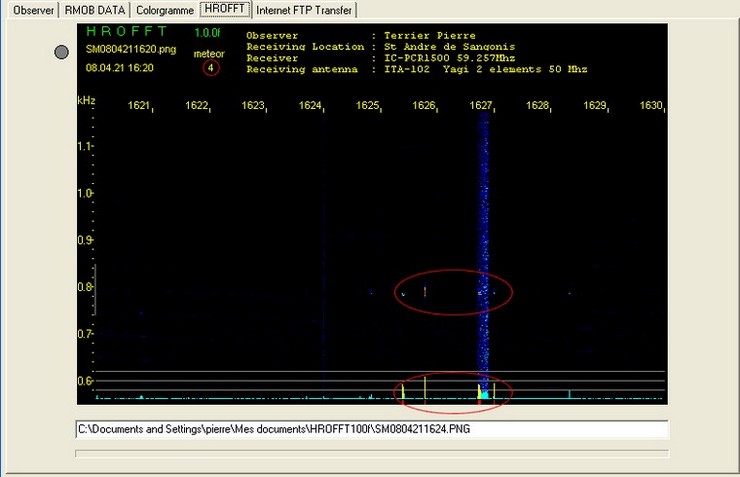
The HROFFT tab shows you the last image analyzed by Colorgramme. Here it is very quiet with only 4 posts between 4:20 p.m. ET 16:30 on 21-04-2008. Colorgramme will automatically load new images HROFFT and analyzed to find the echoes. It sounds silly but HROFFT factory no text file with the number of echoes. The designer must think that every observer "undercut" the data manually.
Either way it's commendable because it's true that automatisms are sometimes wrong, but a well-tuned system gives results as good as a "manual" observer.
To know the details of the operation, I invite you to read the user documentation in PDF (in English)
Colorgramme v 4.0 user documentation
The FTP page is also simple and allows you to set and view transfers to http://www.rmob.org and follow the evolution of your data and that of others observers worldwide.

|