Colorgramme V 2.0 Help
The author name processing "Cooking" in menu command, it is humor...
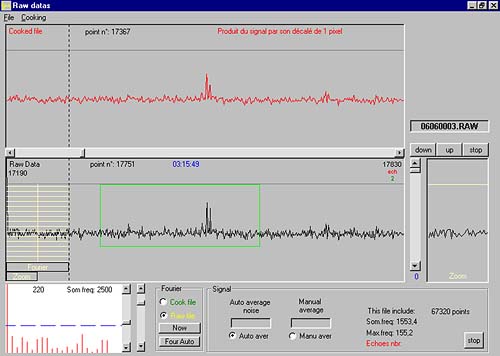
Here is the aspect of the main window of raw file processing (* .raw) of
Colorgramme v 2.0.
It is gotten since the software by the control " File, See RAWdata"
It is since this window that the hourly files synthesized by Meteor will be observed. The 1st stage is of course to open one of it, by " File; open ". After some seconds, the window of the bottom fills itself
Visualization window indicators :
to move in the file, use the horizontal scroll bar. One can extricate the cursor, but the scrolling doesn't make himself in direct. This scroll bar " is sometimes carried away ", a click or two in the bar and wait for a new display.
The hour and the number of the point of measure is given to the place of the mouse. Him maybe necessary to click once in the window to activate him. The hour is not correct if the file really makes 1 whole hour and himself not begins precisely at hh.0000
If the file comes from Meteor v 4.0, it is associated to a file * .ndx, that gives the position of echoes measured by Meteor. The window shows in green a setting surrounding the found echo, and writes down himself (in green also) his number.
On left of the window, a grid regains the zone of data processed in direct by Fourier discreet transform (TFD). Every measured frequency is indicated in the white window all in bottom.
A mini zoom also shows a small portion of data (left half of the grid), dilated horizontally by a factor 2.
Processing : ( Cooking for the author... humor ! )
1 / Auto noise average :
Programs It explores the totality of the file by small portions, he searches for the zone least susceptible to contain a signal. Anything is not drawn to the screen, but in bottom show off values of this background noise, and well place of the file where he is found.
2 / manual average :
You must select to the mouse a zone of data of which you want the average. To the slackening of the mouse, the value of the manual average displays himself (low of screen).
3/ Deviations / average suppression :
a / Select the wished average first (Auto or manual), through the intermediary of the check box option situated under one of the two averages. By default, it is the automatic that will be chosen.
b/ The window of the top fills itself then of the signal gotten by the subtraction, for every point of the raw signal, of the value of his gap in relation to the previous average.
c/ To refine results, use the small vertical scroll bar that has just appeared then in loud on the right, he/it permits you to change the applied coefficient aside before withdrawing it of the signal. You must select " Cooking then; Deviations / average suppression" so that is taken in account.
4/ Multiplication of signal and its shifted :
The signal is multiplied by a copy of himself shifted of a measure in the time. The result of the product is displayed point by point.
5/ Spectrale distribution :
Not indeed a processing. For the totality of the file, the program counts the number of measures to the value 0, 1, ...255. The result is represented graphically, it gives a more regular gaussian curve, it can give an idea of measures meaningfully distant of the bottom noise (uncertain) and therefore probably of echoes.
6/ Causale movable average :
The processed signal is constructed of the following way: The average of three consecutive measures is made, and affected to the position of the third point. She would have been no causal if the first point had been victim of the affectation.
7/ Magic :
Processing no exploited again on this version, but considered future implementation. An uncertain signal is calculated, multiplied by the raw, every point is colored in red, and the keyboard is dived in the liquid helium. The result doesn't represent big thing, but for what one knows some, it is maybe the case of the other methods
The detection of echoes can make himself very well on the raw file, either on the processed file. It is the slot of option of framed " it Fourier " that determines it.
The "Now" button does a transformed of discreet Fourier (TFD) there where is located the grid. In fact, at the time of the scrolling, the TFD is made automatically, there is only at the time of the invert (processing file)-(raw file) that this button is necessary. One way or the other, the window of the bottom displays the result on the left under shape of a small histogram: he contains every restrained frequency in the portion of signal worked, the height of the stick is proportional to the intensity of this frequency. In fact, when an echo is discerned, it appears most the time by a portion of broadcast radio, that contains sinus frequencies, that reveal the TFD therefore. More sticks are high, and more there is luck that some that is not the noise is received.
The button " Four. Auto " scan the signal, made of the TFD portion by portion, and account himself that is considered like an echo. A small vertical scroll bar adjusts the sum of frequency intensities: to the over of this threshold, the signal will be judicious to contain an echo. The sum of echoes is displayed on the right in bottom, while doing to move the signal, some red settings show are situated where the echoes found. It is to compare to the green settings found directly by Meteor.
Philippe Boeuf