Preamble
The WMeteor software functions correctly
only if your radio installation is stable and can detect meteor echoes
effectively. Concerning the materials necessary see the
technical pages of Meteor web
site.
Dave Swan (U.K) created a protocol to
the test the stability of your radio installation. I strongly recommend you
read it to assure that only a received signal from an echo is counted. |
|
|
Meteor System Set-up by Dave Swan
(UK) |
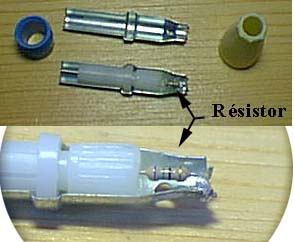
How to
build?
Take a 50/75 ohm plug and solder one end of
a 50/75 ohm resistor to the centre pin and the other end to the outer
case. |
1. Connect up the system and set the receiver
to the frequency in use.
Terminate the receiver antenna input in its
Characteristic Impedance, this is usually 50 ohms for professional or scanning
receivers and 75 ohms for Band 2 FM stereo receivers. Use only carbon resistors
not wire wound.
Reset the system and adjust the Threshold controls
above and below the displayed Noise level so that the system is not triggered
into producing a count. If the system is triggered adjust the necessary threshold
to prevent this. When the system is running with no triggering observe for
at least 30 minutes to confirm no random triggering of the system.
If random triggering persists the probable
cause is man-made noise getting through the power lines or computer hash
usually the monitor, fit an appropriate filter.
If an RF Signal Generator is available, see
Annex A.
Continuing from 3. Observe the displayed noise
level and remove the terminating resistor and refit the antenna, if the antenna
is a good match and there is no man-made noise present, you should see no
major increase in noise.
Reset the system, and you are ready to start
observing.
Changing any of the system components will
require system Reset.
This set-up is to ensure that the system itself
is not generating false counts!
Annex A: At this point the system sensitivity
can be measured.
If any problems occur with this procedure contact:
daveswan@dorsetpubs.com |
Summary
About Colorgramme
WMeteor
|
-
About
Colorgramme WMeteor
Colorgramme WMeteor v 1.0 is a next and
merged
version of Colorgramme v 2.2 and
WMeteor v 1.1
This new software is created in 2002 by Philippe Boeuf and Pierre
Terrier.
Thank's to Beta tester
:
Verner Blindheim ( Norway )
Patrice Guerin ( France )
Stan Nelson ( USA )
Dave Swan ( UK )
Bruce Young ( Australia )
Colorgramme v 2.2 is a Freeware and WMeteor
v 1.1 is a Shareware !
The fusion give a Shareware with a Freeware part.
WMeteor part , Sky Map is a Shareware and Colorgramme and RMOB Stats is a
Freeware.
The Register price of Colorgramme WMeteor is
20 Euros ( ~ 20 US$ )
Order available by check or cash by post to
:
Pierre Terrier
65 rue de la ville
34800 Canet
FRANCE ( Europe )
486 DX to Pentium III PC computer
VGA 640x480 color SCREEN minimum
Windows® 95-98
WMeteor acquisition doesn't work under XP..., but the others parts work properly.
Unzip colorwmv1.zip file then run
colorwmv1.exe file and follow setup instructions.
-
Before
running ColorWMeteor !
WMeteor is foreseen to work SOLELY in Universal
Time!
WMeteor uses the hour of your computer that is why it is INDISPENSABLE to
configure the clock in your Windows parameters correctly.
1°) in the start menu of Windows select " Parameters " then " Configuration
Panel".
2°) open clock setup. |
 |
3°) select the tab " time zone " in
the list of places select "
GMT hour of
Greenwich, Dublin ... ", uncheck
the box" to Adjust the clock for the automatic observation of the hour of
summer" (only in France ???) Validate, close then run WMeteor.
|
 |
By default Colorgramme WMeteor running in English
language, but it is available to change the language by click on the country
Flag on top of the Observer page.
-
Observer
a essential sheet for a good work of the
soft.
Many Part of the software use a informations
filled in this page. |
Your Name is used for create the name of file
of WMeteor and your location infos is used in the Sky Map Part.
For a good running please fill in first your Name and the others infos then
press Save button !
Here, my Datas in the Observer Form. |

|
WMeteor TabSheet display all control parameters
to drive your Meteor electronic Interfacing.
If you don't see what is it, see
http://radio.meteor.free.fr |
Choose the PC?s Com Port (ex. COM1) where your
Meteor Electronic Interface Box (MEIB) is connected.
Now, Meteor will adjust the sampling. The time
it will take depends on the computer speed and the strength of the low-frequency
signal from the output of your receiver. At the end, the colour of the trace
changes from red to green and Meteor evaluate the Window?s time scan. |

At the end of sampling, you adjust the
Threshold and delay time by respective scroll bars.
In this example one echoe come
while I adjust the threshold ! |
-
Files created by Cologramme
WMeteor
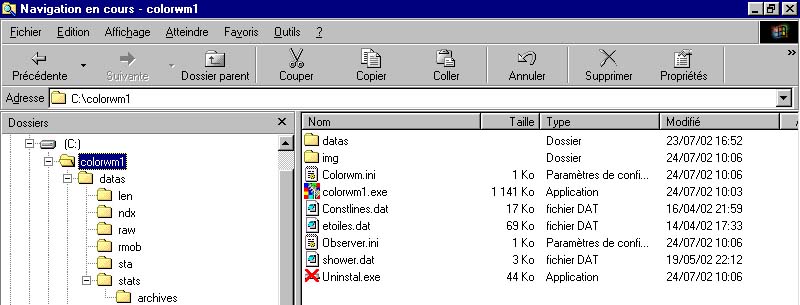
Colorgramme WMeteor create
automatically many file necessary for work properly
STA ( Statistic ) files is a simple text
file created daily for store the number of echoes counted
hourly.
LEN ( Length ) files is a simple text file created daily for
store the length of echoes counted hourly.
RMOB files is a simple text file created monthly for
store the STA or LEN datas. This files is currenlty used by
www.rmob.org
and by Colorgramme to display under graph your datas.
Colorgramme WMeteor create 1 RMOB file for your STA
datas and 1 RMOB file for your LEN datas.
All files are stored in Subdirectory. It is most easy to find the searched
files.
One simple click on check box display the datas values or not. And if
you click on LEN, you see your LEN datas.

And if you click on the histogram, you have a possibility to change the color
of the datas display.

Colorgramme TabSheet display by default the current datas observed by WMeteor.
This is the STA datas converted in Monthly RMOB file, displayed in small
rectangles ( one per hour ) with a color representing the level measured.
Red is highest and Blue is lowest. Black is no datas. |
At left you see the "Live On" indicator. This indicator visualize the
time left from last refresh of Colorgramme display ( hourly ).
From Directory is available to use if your datas files is not in .../datas/sta/
( default ) directory, but in other dirve or if your computer
is in network. |

All buttons is for open a different files type and display on Colorgramme
graph. Muli select file with <Open STA> it is available to load 1,2,3,all
files. <Save image> save in BMP image format the Colorgramme graph.
Curve or Histogram select the type of display of daily Stats of the month.
One simple click on the Daily Stats graph permit to change the color of the
graph as in WMeteor. |
Max Auto check box permit a change level of visualization in Colorgramme
Image. |
 |
RMOB Report TabSheet is for send automatically by E-mail your RMOB file to
the RMOB coordinator Christian. Steyaert.
To see more infos on RMOB
http://www.rmob.org |
Fill your Provider SMTP Host in <SMTP Host> area.
Fill your E-mail in <From> area. Your E-mail is automatically copied
in <To :> area because if you clik on <Test Send> button (
recommended), one E-mail is send to you for test.
If this test work properly, then check "Sens automatically..." case. Now
all area is in yellow and you see in <To :> the E-mail of C. Steyaert
and at the 1 first day at 1h of the next month your RMOB file of the currently
month is send to Chris.
|
 |
ATTENTION : If your Internet connection
don't work properly, the next E-mail is not send ! Quit the software
and re-run. |
RMOB Stats TabSheet permit to visualize and analysis the monthly datas
from the observers of the Radio Meteor Observing Bulletin
( www.rmob.org
) |
Here the animated image display the main operations.
Open files with <Open Obs.> button. Multi select is available as our
example. Next the files is automatically added and displayed under
the graph. It is available to see the date of the
maximum activity of the meteor shower. Some observers influence
strongly the curve by their high count level. But if
you want to optimize the curve,
use Observers select combo box à right.
Select an observer and then press <Remove Obs.>
button. The curve on the graph is re-calculated without this observer.
If you see the ideal curve then you save your datas with <Save Stats>
button, and reload with <Import Stats> button. |
 |
Up right selector is for choice the month and year RMOB observers datas.
In our example we chose january 2001 all datas observers. You see Mr Ylka
Yrjola and Ton Schoenmaker increase strongly the curve ( high count ). Next
we remove this 2 observers, but you see this is not really significant, because
their high count hide only a small fluctuations while this month. Only the
big peak at the begin of the month is significant. It is the Quadrantids
meteor shower. The last image of this animation display only one observer
( Ghent observatory ). This part of Colorgramme WMeteor is currently in
development and the new calculation functions is integrated in next versions. |
Colorgramme WMeteor Sky Map is going to permit you know the sky over your
antenna if you have filled correctly the parameters in "Observer"
panel in particular your Longitude and Latitude. The map presents the visible
sky with the main stars and constellations. You will find the sun, moon and
planets. |
The mains meteor shower listed by International Meteor Organisation (
http://www.imo.net ), are
represented as "stars with green sticks" and the dimension is proportional
to the ZHR value. For ZHR explanation see IMO web site.
At the maximum date of the meteor shower this one is drawn in red. RADIO
meteor shower is drawn in fuschia.
The axis of your antenna is drawn in yellow circle with cross.
"Hour Step" permit an adjust from UT for see the sky before or after
PC time. |
 |
All the map is active, a simple clik on an object permits to have access
on the informations it concerning.
The map is refresh regularly all 3 minutes. |
This documentation is currently in progress... |